Climate change through the lens of GIS
Climate change is a relatively loaded phrase that encompasses many things working together to alter the environment. This is a very heated topic but one that I believe to be very important for us to understand, as our surroundings are changing and we need to be prepared for what that means.


It just so happens I'm working on a side-project regarding alternatives to desalination which could provide various benefits if it comes to fruition, most notably would be a convenient alternative to obtaining so the very-limited fresh water we need for survival. That said, the focus of my project was that under the hypothetical that desalination becomes more prevalent (one way or another) - what impact would it have on the environment? To predict this solution, I aimed to answer a number of questions:
- Where is the water coming from?
- What is it used for?
- What if we altered the use of the water - what would happen to the excess?
- What land would be converted to alternative land use?
- Benefits of alternative use of water?
- What kind of timeframe are we looking at?
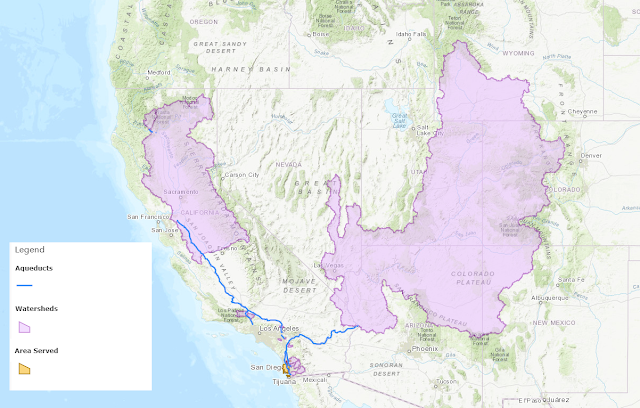
To start with, most of California's water comes from 2 large watersheds:
- Colorado River to lake Havasu watershed
- Larger watershed on right
- Sacramento-San Joaquin Delta (which begins in the Sierra Nevada Mountains)
- Smaller watershed on left

This Figure only shows a couple of the aqueducts for the sake of reference.
This picture demonstrates where some of the water goes, but most of California's water is used in Agriculture.

As you can see, ~80-85% of the states water is used in Agriculture.
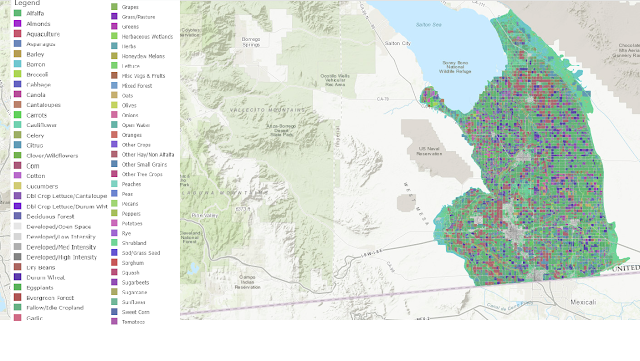
The kind of crops they're producing and the amount produced play a huge role in the amount of water used to irrigate.
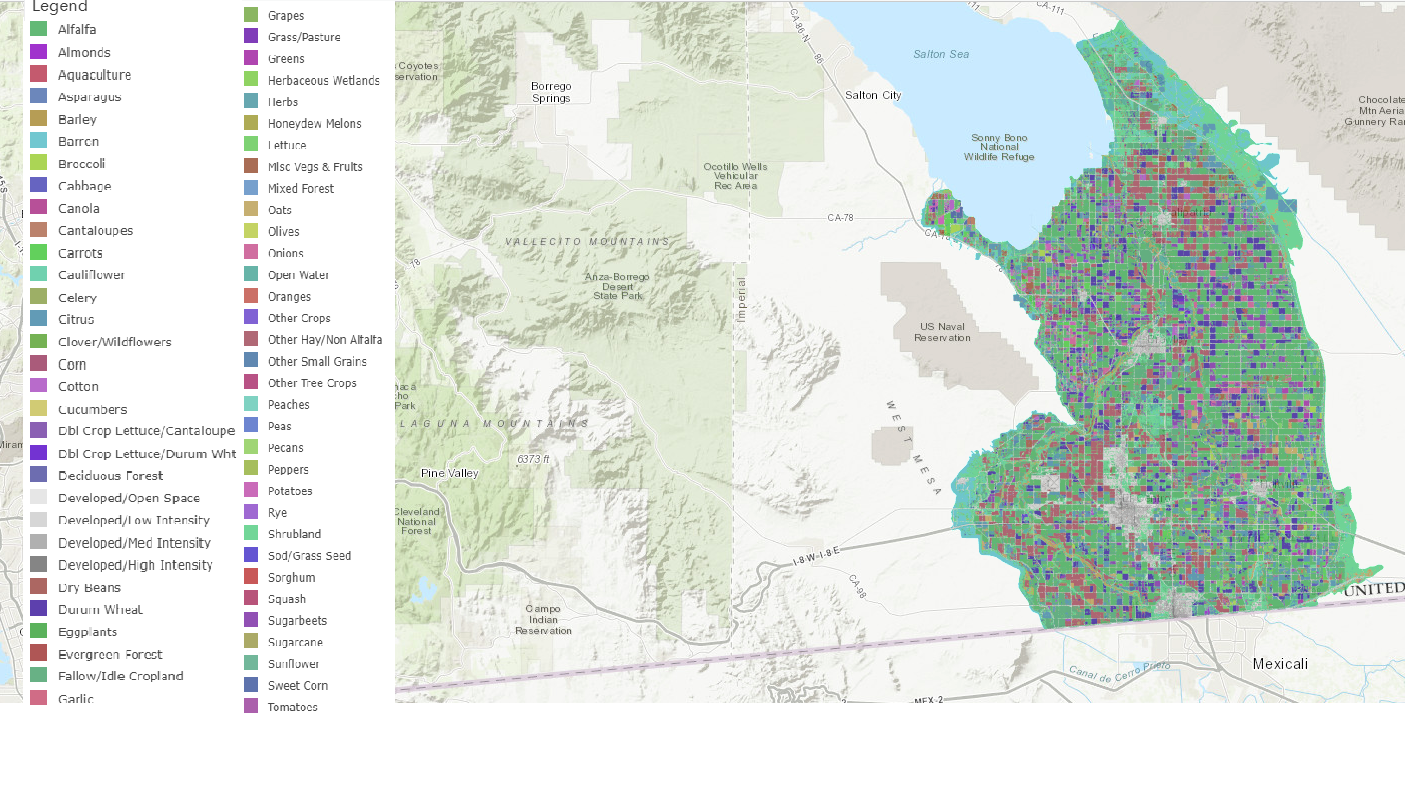
This figure displays Imperial Valley County and its crop type.

Figure 4 displays the water use/acre irrigated as well as the market value of the Ag products produced.
After calculating the total amount of water and total market value, it was found that California as a whole, uses ~218,000,000 gal H2O/day, providing their Agriculture market a whopping $42,621,446,000 of revenue a year.
Now the crazy thing is that that's enough to fill 330 olympic swimming pools...every day. It begs the question of whether it's sustainable?
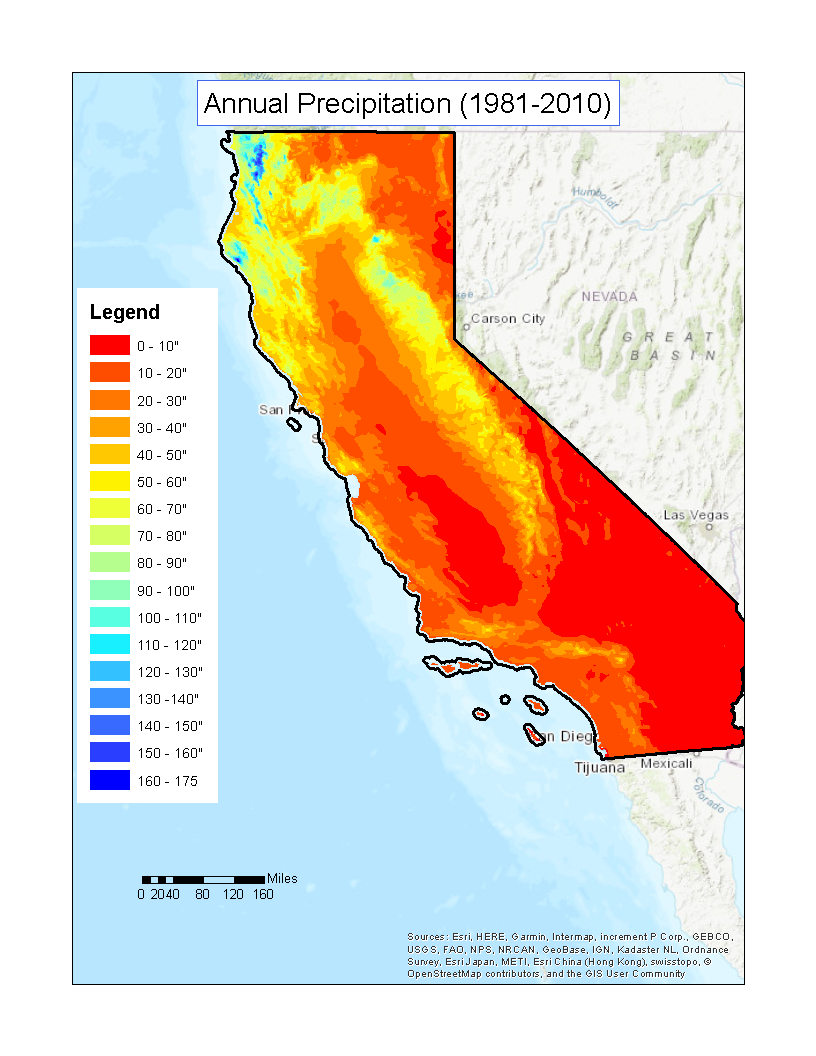
Figure 5 displays the annual precipitation.
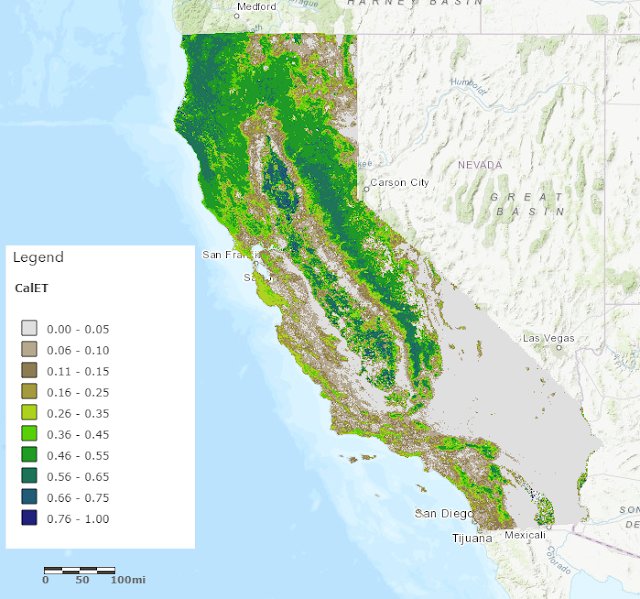
Figure 6 displays the evapotranspiration of the state.

Figure 7 displays the water stress for the state.
It's not like it was a secret that California has seen a number of harsh droughts recently but from these maps, we better picture where and why they have been occuring. Taking into account climate patterns and Agricultural water usage, it's no wonder California is shifting to a drier and drier climate. Its water usage is unsustainable and since precipitation clearly isn't providing enough water to grow crops, groundwater is being tapped to large degrees (up to 60% of water, during periods of drought, is obtained from aquifers).
So what if we altered our source of water income from freshwater to saline water? Say this was the case, then 218,000,000 gallons of water a day, could be reallocated elsewhere, most suitably into restoring the aquifers to their original capacity. Not only does this present the opportunity for the Colorado river to reach the ocean again, but it also allows for arid lands to slowly be reforested by reversing desertification. There are also studies being done to assess the level of affect that areas of higher water tables has on land and its ability to mitigate damage of wildfires.

Figure 8 displays aquifers of the region.

Figure 9 displays wildfire hazard potential data.
Note that the central valley is largely untouched by wildfires which just so happens to be on top of an aquifer, although topography likely plays a large role as well (thus why studies are still inconclusive). However, more water in an area, means saturated soils, saturated leaf litter and less dry trees, all of which contribute to limiting the damage of fires.

Figure 10 displays the relative depth of each region of aquifers and their relative recharge rate.
The reason for providing this map is to given an idea as to potentially the best lands to try and make changes on. For instance, if we focused excess water into planting Almond trees in the arid climate of the South East, it would provide not only the benefit of extra food and money, but almond trees grow in sandier soils as it is, and have been noted to assist in water percolation - which means faster aquifer resupply. It also helps with evapotranspiration in the area, potentially causing more rainfall to occur as well as reduced erosion.
Lastly, there is the idea that if planted in the valley, there is the GHG abatement potential that the Almond trees provide as well. Calculations were done to estimate how much pollution the trees could help clean up.
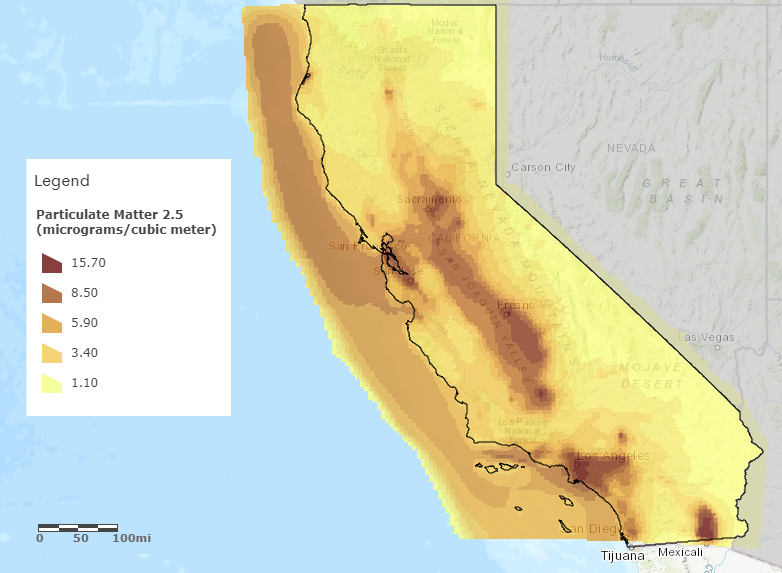
Figure 11 displays the pollution levels of the state. [for reference, the national average is 10 micrograms/cubic meter in 2016]

Figure 12 displays the potential for almond trees to abate (to make smaller or less intense) total Carbon dioxide emissions / acre
Cleaner air, on top of carbon sequestration are just two more added benefits of intentionally altering our climate through hydrologic processes.
Finally, in relation to a time frame, something of this nature would take many years to see results in everything except hydrology. Hydrologic flows typically adjust and stabilize in 2-4 years after alterations.
The goal of it all would be to create a positive feedback loop: increased water to more arid regions (in a controlled fashion) while planting vegetation would slowly turn the land into more fertile land, and a healthier environment. More water also reduces fires impact on the region, reduced fires mean less forest is lost, meaning increased evapotranspiration, ideally resulting in more precipitation.

Comments
Post a Comment