Posts

Showing posts from 2018
Image
Our final project was an independent poster designed to solve a problem of our choosing. The issue I decided to address was biking in Auburn, AL and the possible benefits that could come with it. In large, the poster displays the project itself, but the take home message from it all is that by designing safer biking roads in a proactive manner, we can also create ecosystem services such as carbon sequestration, water filtration and retention, and beautify auburn by incorporating green infrastructure into its design. Auburn has already mentioned in the city council meeting at the end of 2016 that they intend to not only work on transportation in the city of Auburn, but also intended on repaving bike ways and roads as things stand. Why not take it a step further and make Auburn a model in green infrastructure?
Climate change through the lens of GIS

Image
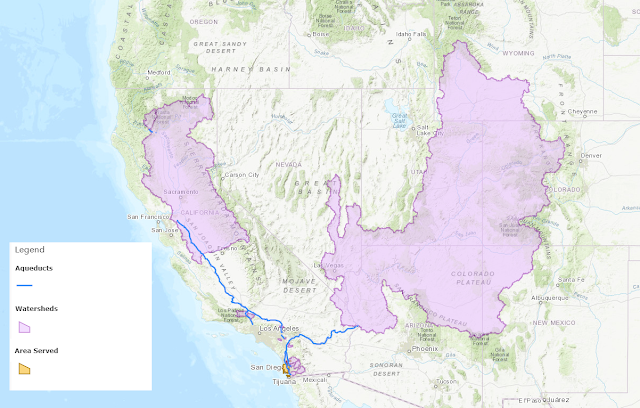
Climate change is a relatively loaded phrase that encompasses many things working together to alter the environment. This is a very heated topic but one that I believe to be very important for us to understand, as our surroundings are changing and we need to be prepared for what that means. It just so happens I'm working on a side-project regarding alternatives to desalination which could provide various benefits if it comes to fruition, most notably would be a convenient alternative to obtaining so the very-limited fresh water we need for survival. That said, the focus of my project was that under the hypothetical that desalination becomes more prevalent (one way or another) - what impact would it have on the environment? To predict this solution, I aimed to answer a number of questions: Where is the water coming from? What is it used for? What if we altered the use of the water - what would happen to the excess? What land would be converted to alternative land use? Ben...
Image
Fall of the Mayan culture - Climate changes fault? Our 3rd project in GIS Apps was to use what available information we have in an attempt to investigate whether climate change was a causal factor in the demise of the Mayan civilization. That being said, let's jump right in. The location of the Mayan culture is largely the Yucatan Peninsula. At it's peak, it was home to approximately 2 million people. The Mayans had quite a few advanced techniques in their repertoire which allowed them to flourish for some time. To begin the project, there's always the painstaking trials of finding data for use in GIS. Thanks to Phoebe, a fellow classmate offering a goldmine of a database, I began by finding the locations of the Mayan cities and cross-referencing their locations with the locations of the many Cenotes (sinkholes) and mines that dot the landscape as both have the potential to provide freshwater sources for local people. In the northern part of the peninsula, th...

Liquefaction as it relates to Wetland Ecosystems

Image
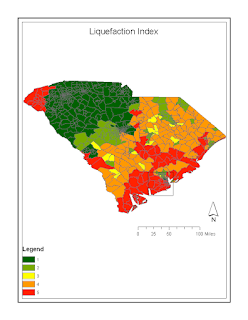
I chose to base my project on liquefaction on the effects it had on wetland ecosystems. I went into this project questioning the damage that would follow any seismic event and the economic impact that would have on local populations but came out with an entirely new interest. With 90 liquefaction sites in this area, 16 intersected with wetlands. The primary wetland type intersected was Freshwater Forested/Shrub lands while of the 2 types of liquefaction, the dominant in intercepted was crater filled.  The data really didn't display any correlation between the liquefaction and wetland location/prevalence. It did raise a potential future research project though: "Could it be possible that crater filled areas provide suitable land for wetland growth? I spoke to my professor in Wetland Ecology & Management and while he said there's never been a study done on that idea, it could make sense, since wetlands need broken up soil to properly function and therefore a ...

Geomorphology in an Urban Environment

Image
Our first project in GIS Apps was to design a mini-project for Geomorphology, specifically in relation to streams. For this project, I wanted to focus on water retention in an urban environment and the effects it could have on the local ecosystem. Being in Auburn, AL, it was most convenient to use data for this location since it was in a proximity that I could go and physically observe. This turned out well since it's quite difficult determining a cities elevation throughout the city, particularly a relatively flat one like Auburn (the city on the plains). I used GIS to determine what I believe to be an optimal location for a new site for permeable pavers. Permeable pavers are a form of roadway that allows water to permeate through into holding cells until it can properly infiltrate into the ground. The Area of Interest (AoI) was selected to be the crossing of W Magnolia Ave and Thomas St. Ponding frequently occurs here, although it was much worse before they added extra stor...